Quinn Griffin · 16 October 2026
Disparities Surface in Flood Defense Funding Across High-Risk Communities
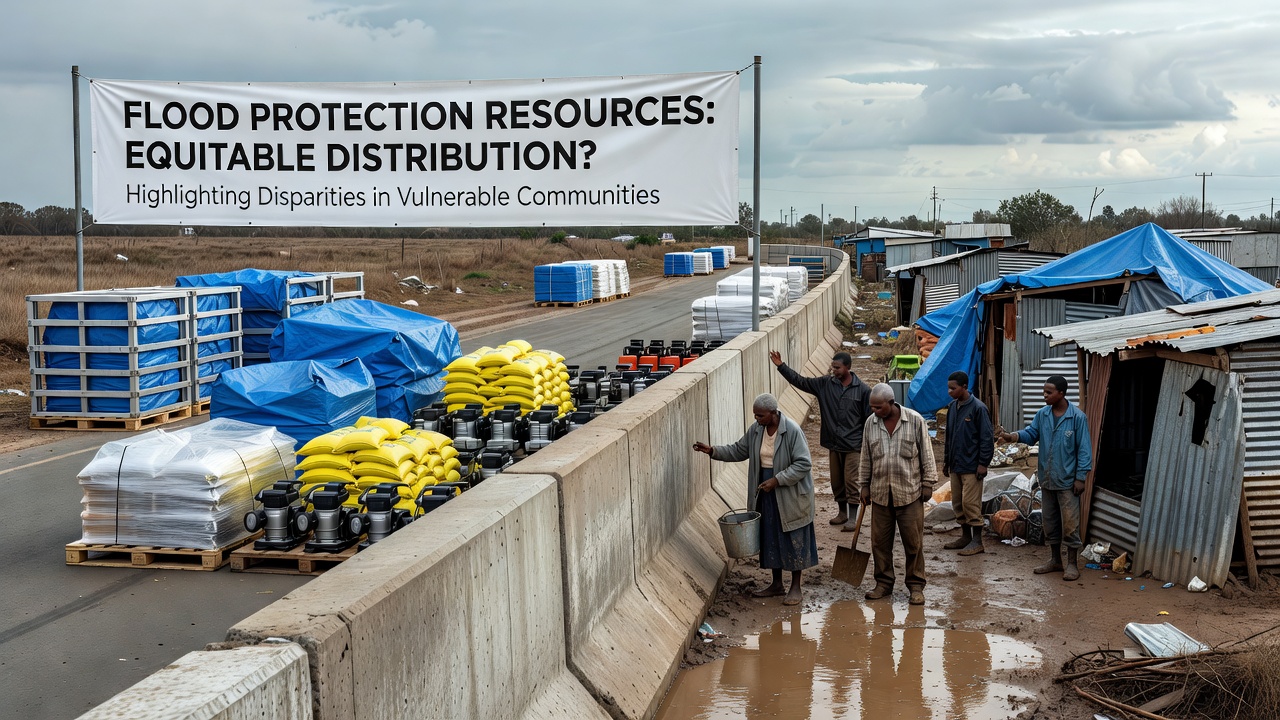
Resource allocation for flood protection continues to show uneven patterns in many regions where vulnerable populations face elevated risks from rising water levels and extreme weather events, and data collected through 2026 reveals consistent gaps in how funding and infrastructure reach certain communities compared with others that benefit from established networks of support.
Observers note that national and regional agencies track these distributions through annual reports while local authorities manage implementation on the ground, yet the resulting coverage often leaves gaps in areas with higher concentrations of low-income residents or limited political influence. Studies compiled by international bodies indicate that such imbalances have persisted across multiple continents even as overall spending on flood defenses has increased in response to climate projections.
Patterns of Allocation in Practice
Funding mechanisms typically prioritize projects based on cost-benefit analyses that weigh property values and economic output, which means densely populated urban centers with commercial assets often secure larger shares of resources while rural or peri-urban zones receive smaller increments spread over longer timelines. This approach produces measurable differences in completed infrastructure such as levees, drainage upgrades, and early-warning systems.
Figures from agencies in North America and Europe show that between 2023 and 2026, allocations in higher-value districts averaged three times the per-capita investment seen in neighboring regions classified as socially vulnerable, and those same districts reported faster completion rates for multi-year projects. Researchers tracking these trends point to the role of pre-existing data layers that feed into decision models, including historical flood records and asset inventories that favor places with better documentation.
Geographic and Demographic Factors at Play
Coastal and riverine communities with older housing stock and limited tax bases frequently appear at the lower end of priority lists, while areas that already possess some protective measures attract additional upgrades through matching-fund programs. This creates a compounding effect where initial advantages lead to further reinforcement and places starting from lower baselines struggle to close the distance.
Data released in October 2026 by monitoring networks across the United States and the European Union documented that neighborhoods with elevated poverty rates experienced 40 percent fewer new flood-mitigation installations per square kilometer than adjacent districts with stronger economic indicators. Similar patterns appear in Australian assessments of inland flood zones where indigenous communities report slower rollout of community-scale defenses despite repeated exposure to seasonal inundation.
Evidence from Multiple Regions
One study conducted across Canadian provinces found that provinces with centralized grant systems achieved more uniform distribution than those relying on competitive bidding rounds, and the latter produced wider variation in final coverage. Analysts examining these outcomes noted that communities able to assemble detailed applications with professional consultants advanced more quickly through review stages.
Meanwhile, reports from the Federal Emergency Management Agency highlight how updated risk maps issued in 2025 and 2026 altered eligibility for certain assistance streams, shifting some previously protected zones into higher-priority categories while leaving others outside expanded funding windows. European Environment Agency summaries similarly describe how member states balancing national and EU-level contributions sometimes channel resources toward already-resilient corridors rather than the most exposed settlements.
Consequences for At-Risk Populations
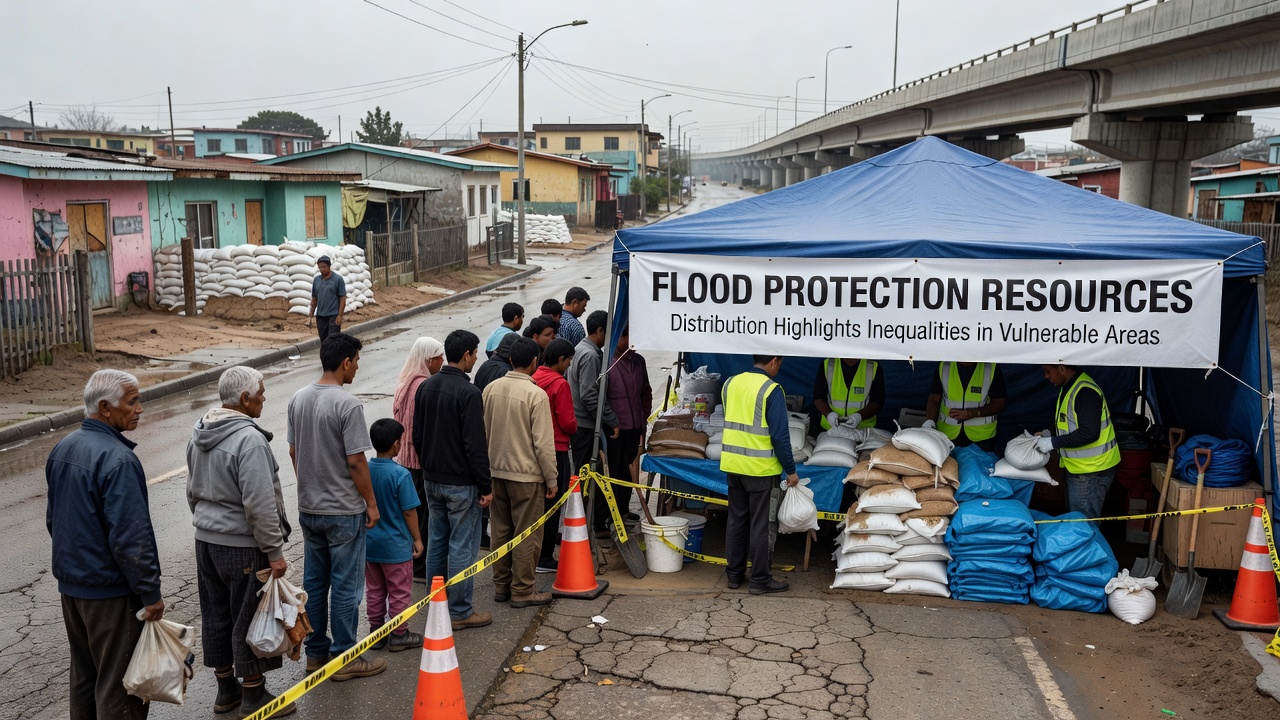
Households in under-served areas encounter repeated disruptions from flooding events that damage homes, interrupt livelihoods, and strain local health services, and recovery timelines stretch longer when permanent defenses remain incomplete. Public health records compiled after major 2025 and 2026 incidents show elevated rates of displacement and secondary impacts such as mold-related illness in districts lacking upgraded drainage.
Local governments in these zones often rely on post-event emergency funds rather than proactive capital programs, which creates cycles of reactive spending instead of sustained investment. Observers tracking insurance penetration rates note that residents in lower-resource areas face steeper premiums or outright coverage gaps, further widening the divide between protected and unprotected populations.
Responses and Adjustments Underway
Some jurisdictions have introduced equity-weighted scoring in grant evaluations to elevate projects serving disadvantaged communities, and pilot programs launched in 2025 began testing needs-based formulas that incorporate social vulnerability indices alongside traditional economic metrics. Early results from these adjustments indicate modest shifts in approved project lists, though full implementation remains gradual across larger administrative systems.
International coordination efforts through bodies such as the European Environment Agency have encouraged cross-border data sharing on best practices for inclusive planning, while national agencies continue to refine mapping tools that integrate demographic layers with hydrological models. Progress depends on sustained political commitment and technical capacity at every level of governance.
Conclusion
Resource distribution for flood protection continues to reflect underlying differences in how regions qualify for and receive support, and the patterns documented through October 2026 underscore the need for ongoing evaluation of allocation criteria. Adjustments in scoring frameworks and data integration show potential to narrow gaps, yet sustained monitoring remains essential to determine whether these changes produce lasting shifts in outcomes for the most exposed communities.